Understanding the Gap Between Private Insurance and Medicare Hospital Costs
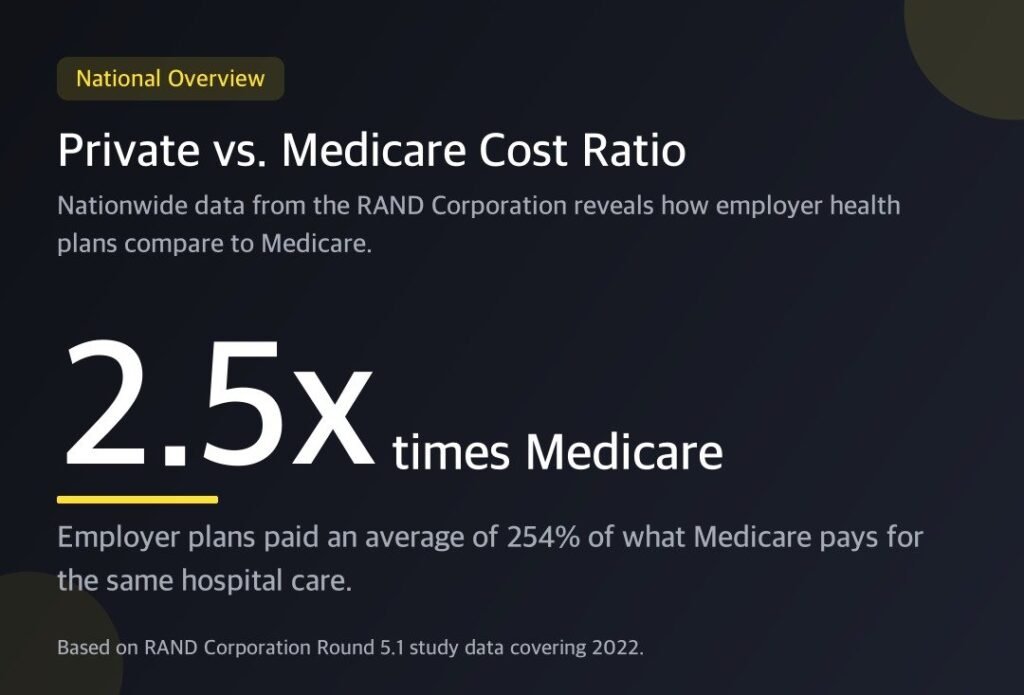
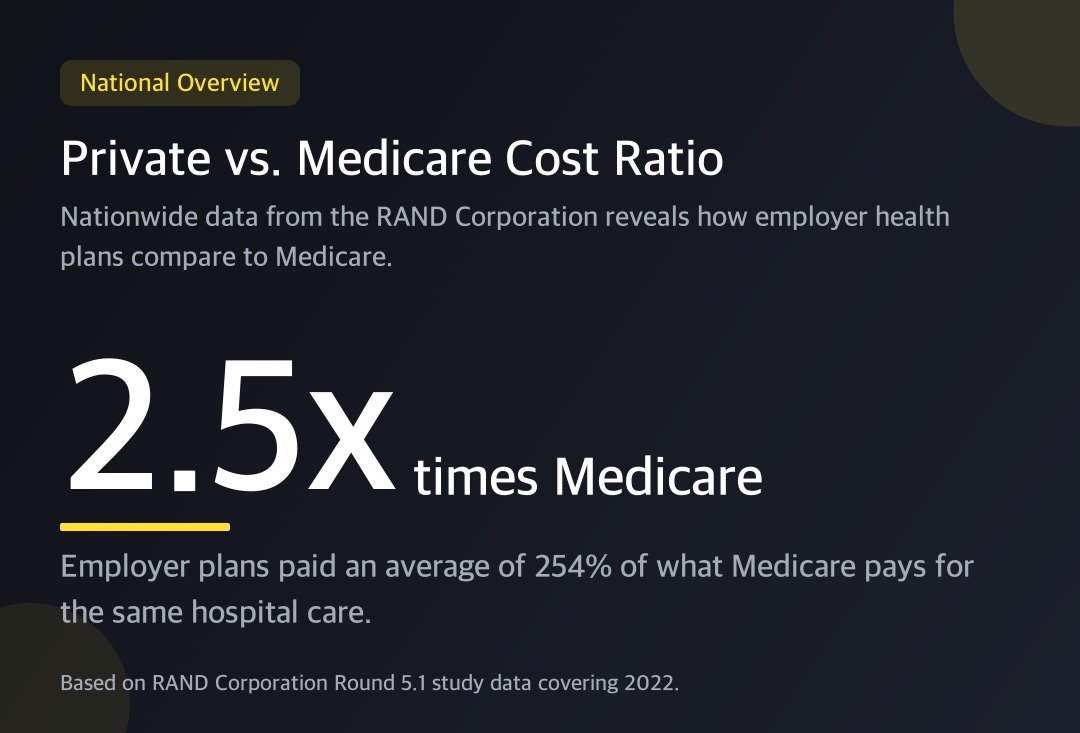
When Americans receive medical care at a hospital, the price tag often depends heavily on who is paying the bill. A study by the RAND Corporation analyzing prices paid to more than 4,000 hospitals reveals a striking disparity: nationwide, employer-sponsored health insurance plans paid 2.5 times what Medicare would have paid (or 254% of Medicare rates) for the exact same care at the exact same facilities.
For Americans navigating healthcare costs, understanding these price variations sheds light on how employer health plans and government programs function across different states.
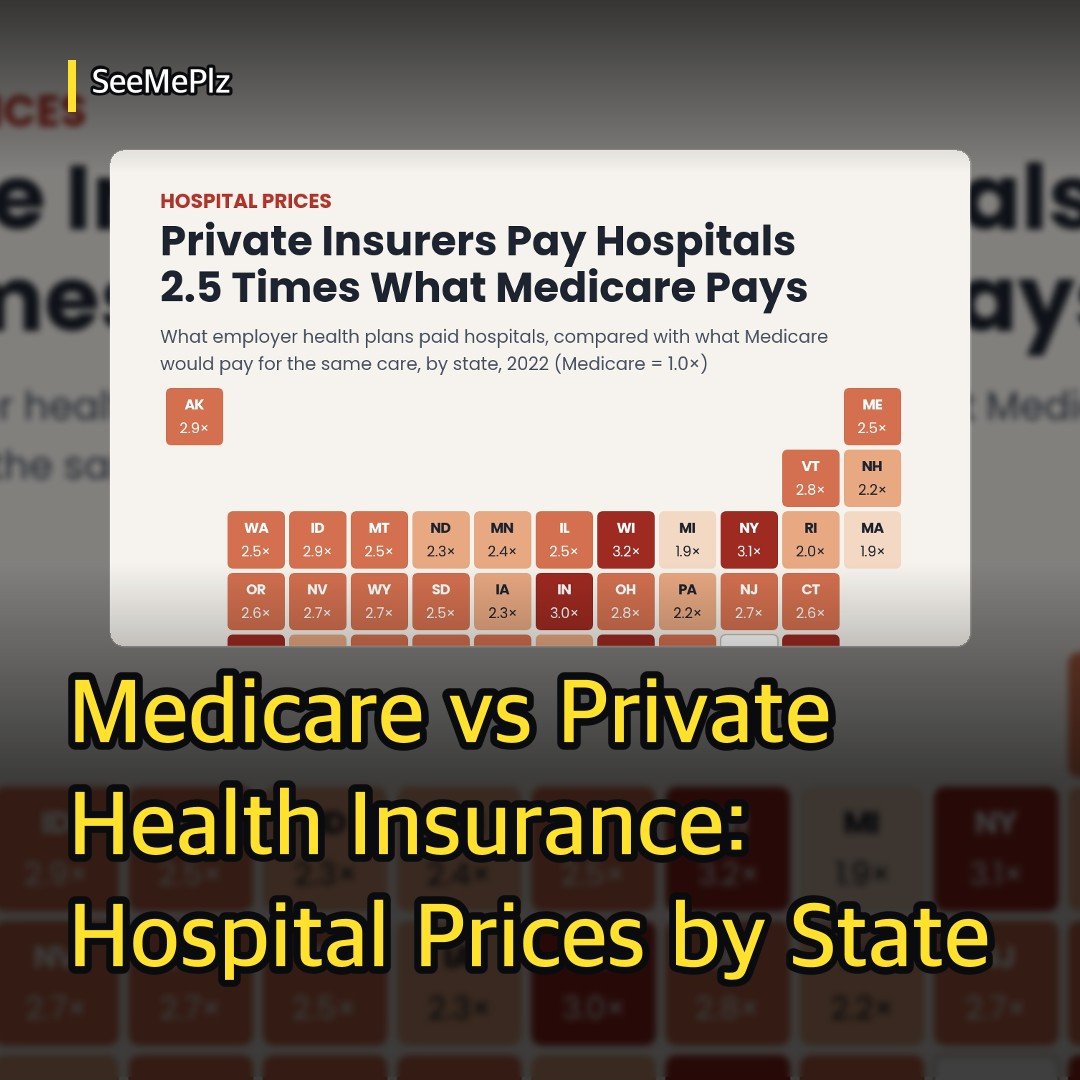
State-by-State Breakdown: Highest and Lowest Hospital Price Markups
According to the RAND Corporation data covering 49 states and Washington, D.C., the price ratio of private insurance to Medicare varies dramatically by geography. (Note: Maryland was excluded from the study because the state sets hospital rates by state law.)
States with the Highest Private-to-Medicare Ratios
- Florida: Highest in the nation at 3.5 times Medicare rates (346%)
- West Virginia: 3.4 times (335%)
- South Carolina: 3.3 times (325%)
- Wisconsin: 3.2 times (321%)
- Georgia: 3.2 times (317%)
States with the Lowest Private-to-Medicare Ratios
- Arkansas: Lowest in the nation at 1.6 times Medicare rates (162%)
- Mississippi: 1.9 times (185%)
- Michigan: 1.9 times (189%)
- Massachusetts: 1.9 times (193%)
- Rhode Island: 2.0 times (197%)
Where Do the Costs Differ? Inpatient vs. Outpatient Care
The markup paid by employer health plans is not uniform across all types of medical services. Breaking down the bill reveals that outpatient care, inpatient stays, and professional fees experience different pricing multipliers.
Taking Florida as an example: * Outpatient hospital care: Plans paid 4 times what Medicare would have paid. * Inpatient stays: Plans paid 3.2 times Medicare rates. * Doctors’ fees (professional services): Plans paid 1.8 times Medicare rates.
These allowed amounts—representing the total combined cost paid by both the health plan and the patient—help illustrate how different service categories contribute to overall healthcare spending differentials across employer-sponsored networks.