For many Americans approaching retirement, Social Security remains the primary income source they expect to rely on. According to a Transamerica Center for Retirement Studies survey cited by Investopedia, four in 10 middle-class Americans in their 60s plan to depend on these benefits after leaving the workforce, while just under half count benefit cuts among their greatest retirement fears.
While your monthly Social Security check reflects your lifetime earnings rather than your current address, where you choose to live plays a massive role in how far that money actually goes. An Investopedia analysis reveals that the states where benefits stretch the furthest are not necessarily those with the biggest checks, but rather those with lower local living costs.
Which States Stretch Social Security the Furthest?
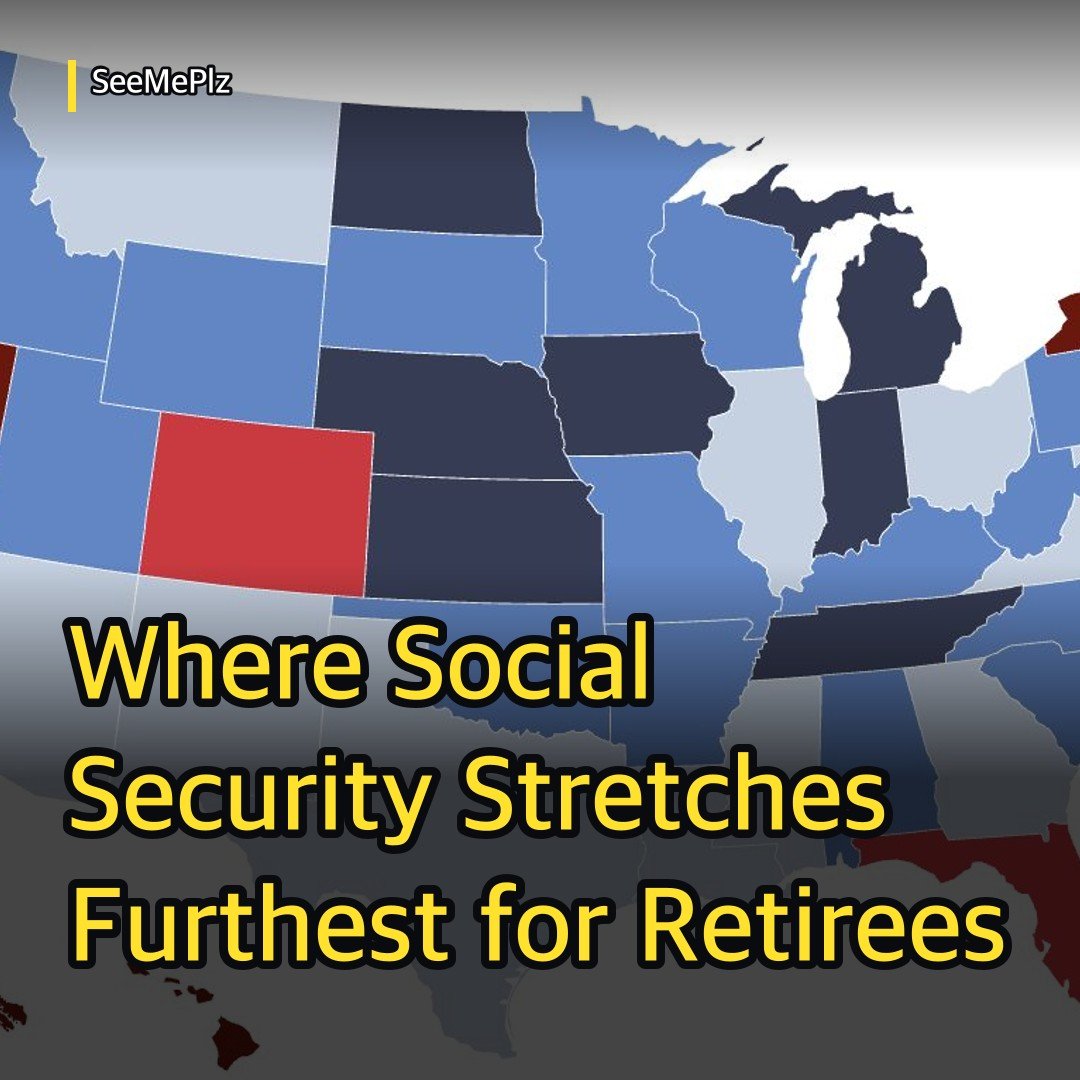
Living costs heavily influence how much of a comfortable retirement budget an average monthly Social Security check can cover. Lower expenses—rather than oversized checks—allow benefits to cover a significantly larger share of annual costs in leading states.
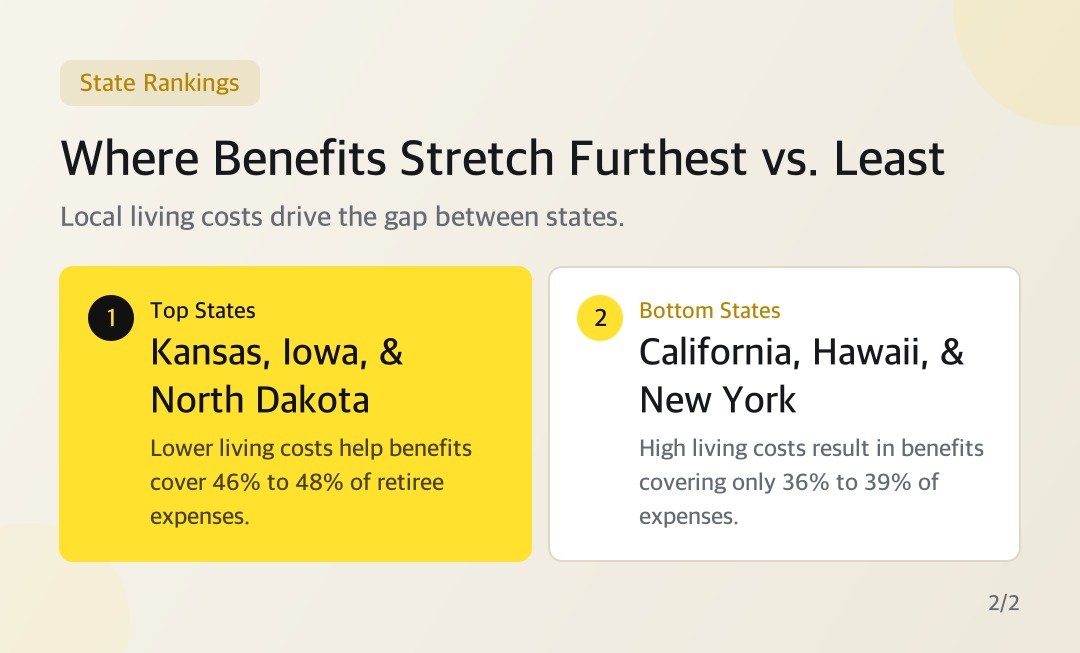
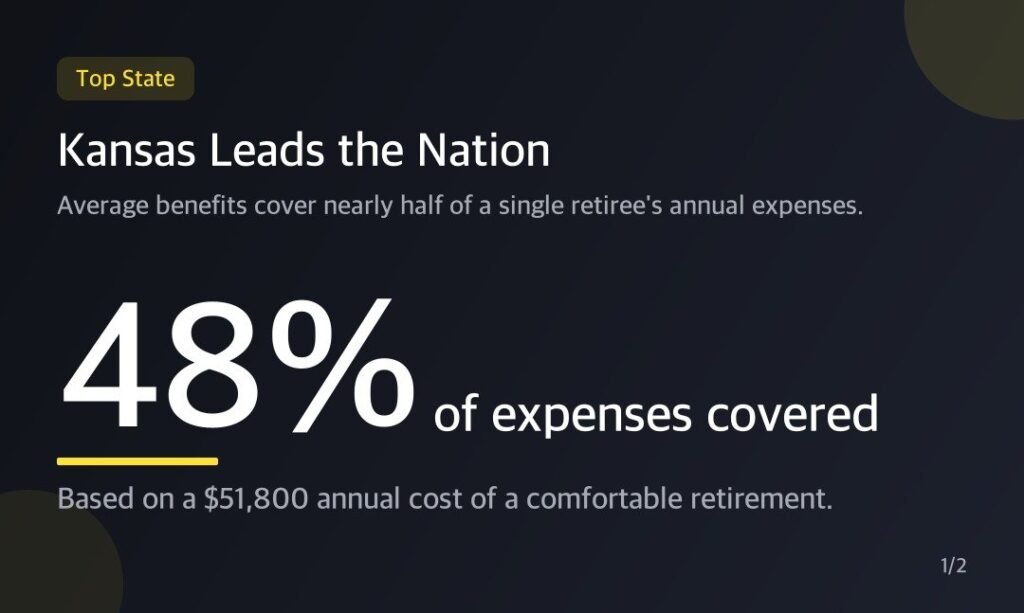
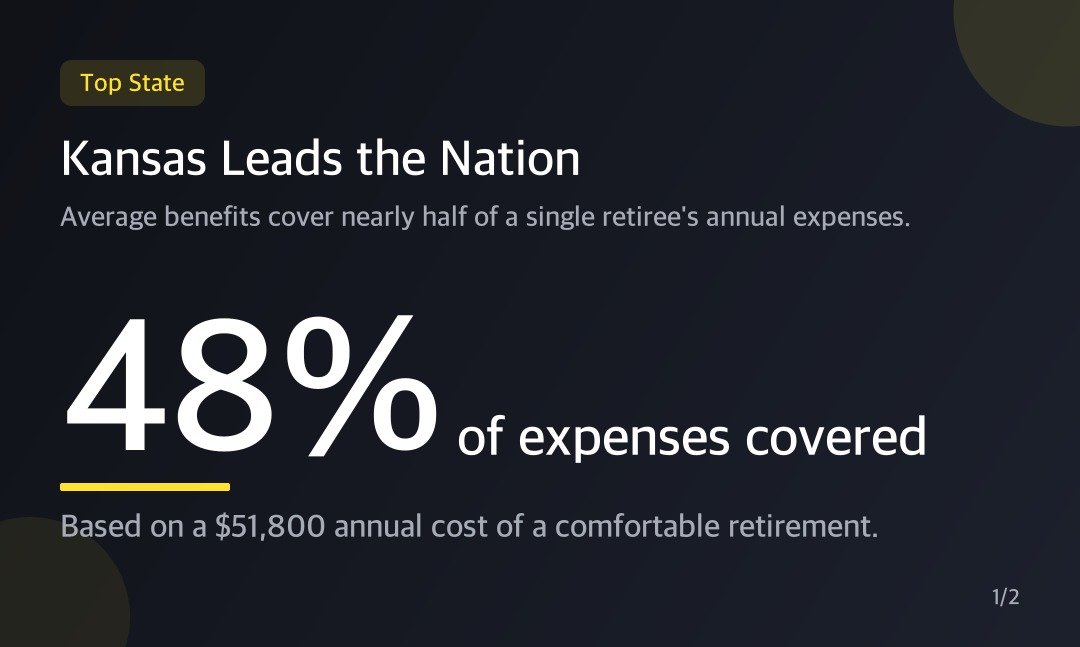
- Kansas: Leads the ranking, with average benefits covering 48% of a single retiree’s estimated annual expenses (roughly $51,800).
- Iowa, North Dakota, and Indiana: Follow closely, with average benefits covering about 46% to 47% of expenses.
- Delaware: Rounds out the top five, covering 46% of retirement expenses.
Overall, seven of the top 10 states are located in the Midwest and Plains, alongside Tennessee and West Virginia, which also rank high largely due to low living costs.
Where Social Security Covers the Least
At the opposite end of the spectrum, high-cost states make it much harder for fixed benefits to cover standard retiree expenses.
- California: Ranks last, with Social Security covering only about 36% of annual expenses for a comfortable retirement. It combines a below-average $1,935 monthly benefit with the nation’s third-highest estimated annual costs of about $64,300.
- Hawaii: Covers 37% of expenses.
- District of Columbia: Covers 38% of expenses.
- New York: Covers 39% of expenses.
Interestingly, a larger average Social Security check does not automatically mean retirees need a smaller nest egg. For example, New Jersey features the nation’s second-largest average benefit but ranks 43rd in the share of expenses covered. Meanwhile, Connecticut boasts the nation’s highest average benefit, yet it covers just 43% of expenses, leaving it right in the middle of the pack.
How the Analysis Was Measured
Investopedia measured how much of a comfortable retirement for a single person each state’s average Social Security benefit covers using 2024 federal data, which is the most recent year with every source available.
- The Expense Side: Combines housing costs from the Census Bureau’s American Community Survey with nonhousing spending from the Bureau of Labor Statistics’ Consumer Expenditure Survey. These costs were adjusted using the Bureau of Economic Analysis’ Regional Price Parities.
- Comfortable Budget Definition: Defined as the average spending of Americans 65 and older—including travel, restaurants, and entertainment—rather than a bare-bones or median budget.
- The Benefit Side: Uses each state’s average monthly check for retired workers for December 2024.
Keep in mind that these benchmarks exclude potential state income taxes, senior property-tax exemptions, and long-term care costs you might encounter. Because benefits move with you when you relocate while your living costs change, understanding these state-by-state differences can help you plan a more secure retirement.